
Learning Math/CS/Engineering Design with Robotics
Draw a City in Two-Point Perspective
|
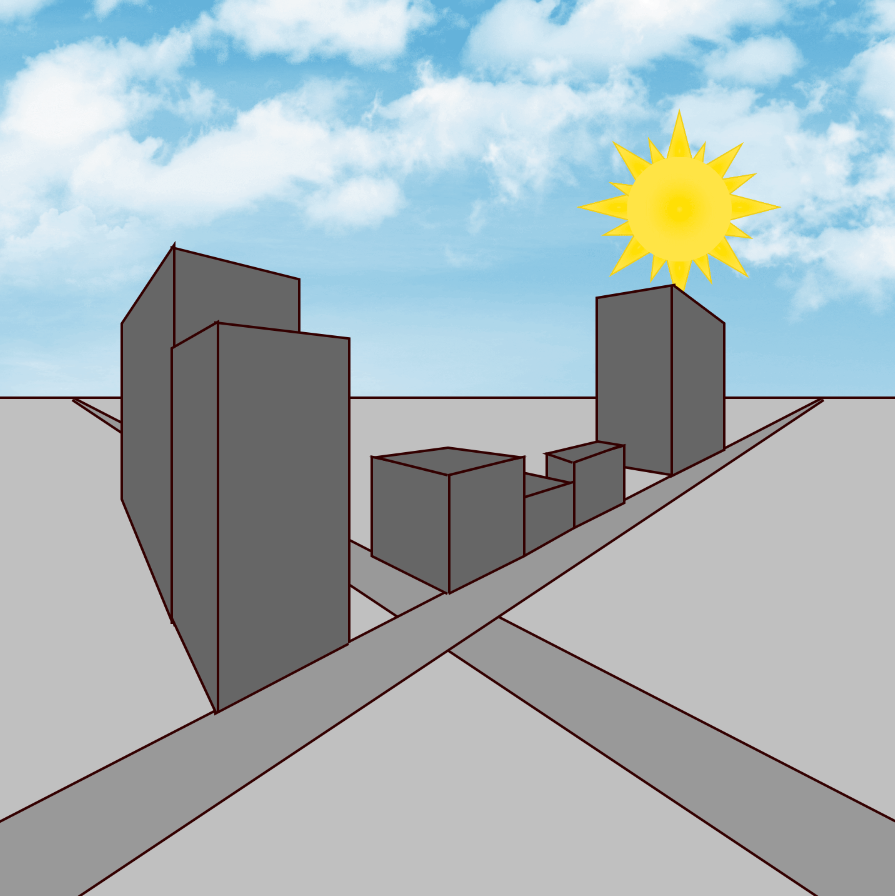
Watch the following YouTube video: https://www.youtube.com/watch?v=yNq78n02fMQ You will create a simpler version of the city drawn in this video similar to the drawing shown above. The board blocks generate lines that you can use as a guide when drawing the buildings. The pre-placed blocks draw two of the buildings. Add blocks to draw the rest of the buildings and add color. Delete the board blocks once the drawing is finished.
|
| Grid Size: S M L | Simple View: | MinView: |
|
|
|
| Coord: x-axis y-axis | Grid Lines: x-axis y-axis | |||
| Grid: | 12x12 inches | 24x24 inches | 36x36 inches | |
| 72x72 inches | 96x96 inches | 192x192 inches | ||
| 1x1 inches | 2x2 inches | Fraction: | ||
| xy-Range: | ||||
|
|
||||
|
|
||||
| Quad: | 1 Quadrant | 4 Quadrants | 1&4 Quadrants | |
| Units: | US Customary | Metric | Ruler: | |
| Labels: |
|
|
|
|
Font
px
|
|
| Tics Lines: |
|
Width
px
|
| Hash Lines: |
|
Width
px
|
1. Linkbot
|
(
,
in
) in
|
|
 degrees
|
|
Width
px
2. Linkbot
|
(
,
in
) in
|
|
|
degrees
|
|
Width
px
3. Linkbot
|
(
,
in
) in
|
|
|
degrees
|
|
Width
px
4. Linkbot
|
(
,
in
) in
|
|
|
degrees
|
|
Width
px
5. Linkbot
|
(
,
in
) in
|
|
|
degrees
|
|
Width
px
6. Linkbot
|
(
,
in
) in
|
|
|
degrees
|
|
Width
px
7. Linkbot
|
(
,
in
) in
|
|
|
degrees
|
|
Width
px
8. Linkbot
|
(
,
in
) in
|
|
|
degrees
|
|
Width
px
9. Linkbot
|
(
,
in
) in
|
|
|
degrees
|
|
Width
px
10. Linkbot
|
(
,
in
) in
|
|
|
degrees
|
|
Width
px
11. Linkbot
|
(
,
in
) in
|
|
|
degrees
|
|
Width
px
12. Linkbot
|
(
,
in
) in
|
|
|
degrees
|
|
Width
px
1. OmniBotA
|
(
,
in
) in
|
|
|
degrees
|
|
Width
px
2. OmniBotA
|
(
,
in
) in
|
|
|
degrees
|
|
Width
px
3. OmniBotA
|
(
,
in
) in
|
|
|
degrees
|
|
Width
px
4. OmniBotA
|
(
,
in
) in
|
|
|
degrees
|
|
Width
px
5. OmniBotA
|
(
,
in
) in
|
|
|
degrees
|
|
Width
px
6. OmniBotA
|
(
,
in
) in
|
|
|
degrees
|
|
Width
px
|
|
You will create a drawing of a city in two-point perspective. The board blocks draw lines to use as a guide, and the pre-placed blocks draw two of the buildings. Add blocks to draw more buildings and add color to the drawing. Then erase the board blocks once the drawing is complete. |
|
Pre-Board Workspace
|
|||||||||||

Post-Board Workspace
|
|||||||||||